Gas Motions in the Intracluster Medium
predicting and explaining observations
Overview
Direct measurements of ICM velocities are limited. The Hitomi X-ray Observatory was launched in 2016 and made the first direct ICM measurements of Doppler shifting and broadening of emission lines in the Perseus Cluster, using its microcalorimeter instrument (Hitomi Collaboration et al. (2016), Hitomi Collaboration et al. (2018)), and the follow-up XRISM mission has recently observed a number of galaxy clusters. I am currently a Guest Scientist with the XRISM team, involved primarily on the Perseus and Coma target teams.
Mapping Turbulence in the Coma Cluster
The Coma Cluster is a bright and nearby system which shows signs of recent merging. It has a large (~300 kpc) nearly constant-density core region, implying that the gas has little stratification. There is no central active galactic nucleus as there is in other clusters (like Perseus). Coma is therefore an ideal system to study the properties of ICM turbulence.
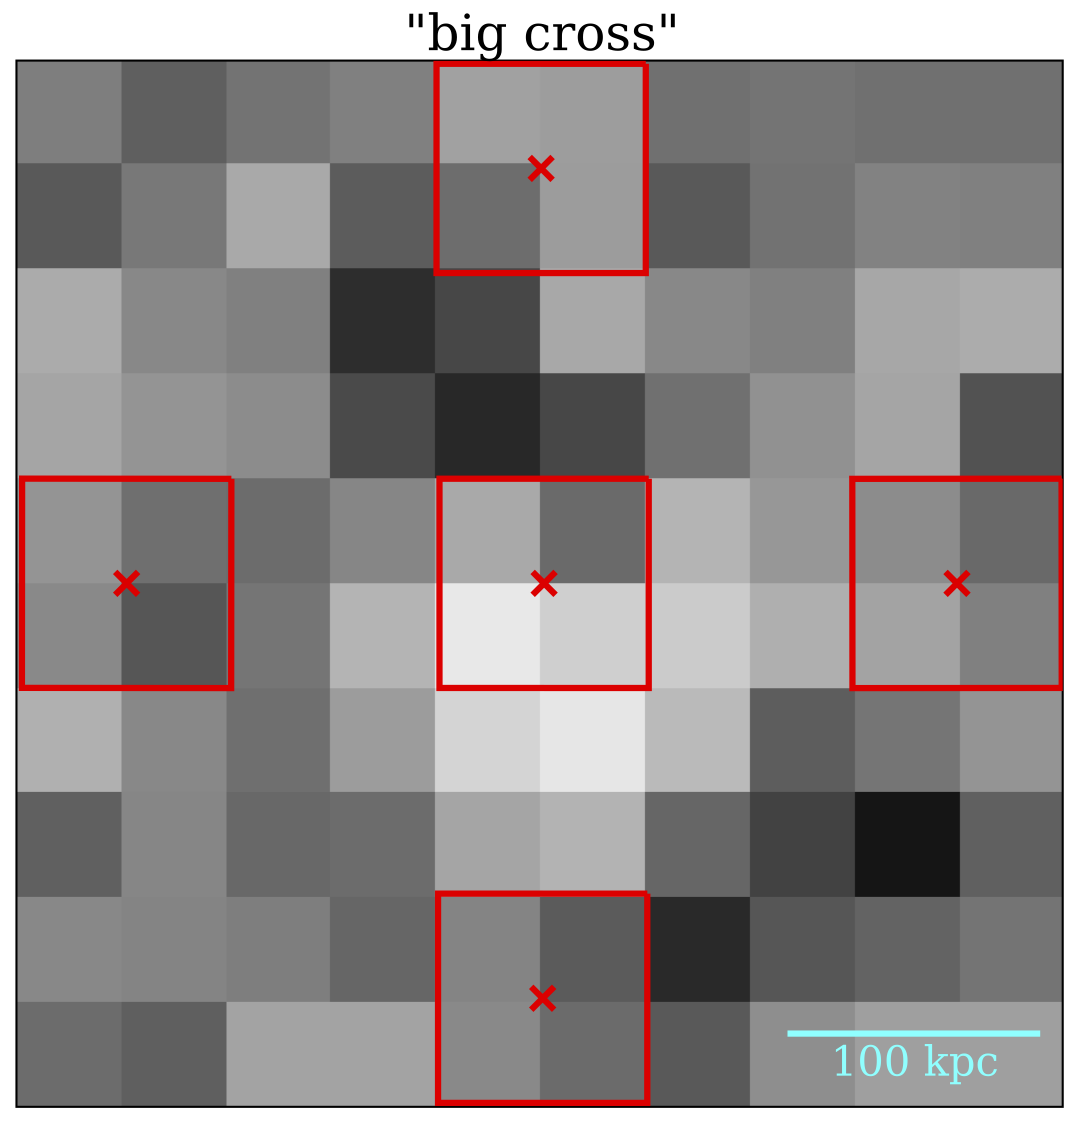
In (ZuHone et al., 2016), I presented a strategy for mapping the turbulent velocity field in the Coma Cluster with Hitomi. Velocity turbulence can be characterized by a power spectrum, which is a function P(k) giving the amount of power in the velocity field at a given inverse length scale (or wavenumber) k. The power spectrum can constrain important physical properties like the injection scale of motions, the viscous dissipation scale, and the slope of the turbulent cascade in between these scales. Since this quantity is determined in Fourier space, it is difficult to measure in real observations, which are often not spatially continuous. Instead, the second-order velocity structure function can be calculated, which is the average squared difference between pairs of velocities for a given spatial separation, or:
\[SF(\ell) = \langle{[{\bf v}({\bf r} + {\bf \ell})-{\bf v}({\bf r})]^2}\rangle\]This quantity (up to constant additive and mulplicative factors) is directly related to the power spectrum via the Fourier transform, and it can be calculated for any arbitrary set of points on the sky on which the velocity is measured. In (ZuHone et al., 2016), we showed that while Hitomi would not be able to constrain the viscous dissipation scale due to its limited angular resolution, by spreading out the velocity measurements over a wide angular scale the injection scale of turbulence could be recovered (Figure 1). These insights are currently being used in the analysis and interpreation of the recently obtained XRISM observations of the Coma Cluster.

Measuring Sloshing Motions in Cool-Core Clusters
Cool-core galaxy clusters (such as Perseus, Abell 2029, Centaurus, etc.) are also the sources of interesting gas motions, despite being more relaxed. These are turbulence driven by central active galactic nuclei (AGN), and the “sloshing” gas motions driven by mergers and associated with cold fronts (see the page on cold fronts for more details). In this case, the cooler, denser gas below the front surface is moving at roughly 30-50% of the local sound speed, which should be detectable with microcalorimeter instruments such as Hitomi and XRISM if some of those motions are directed along the sight line.
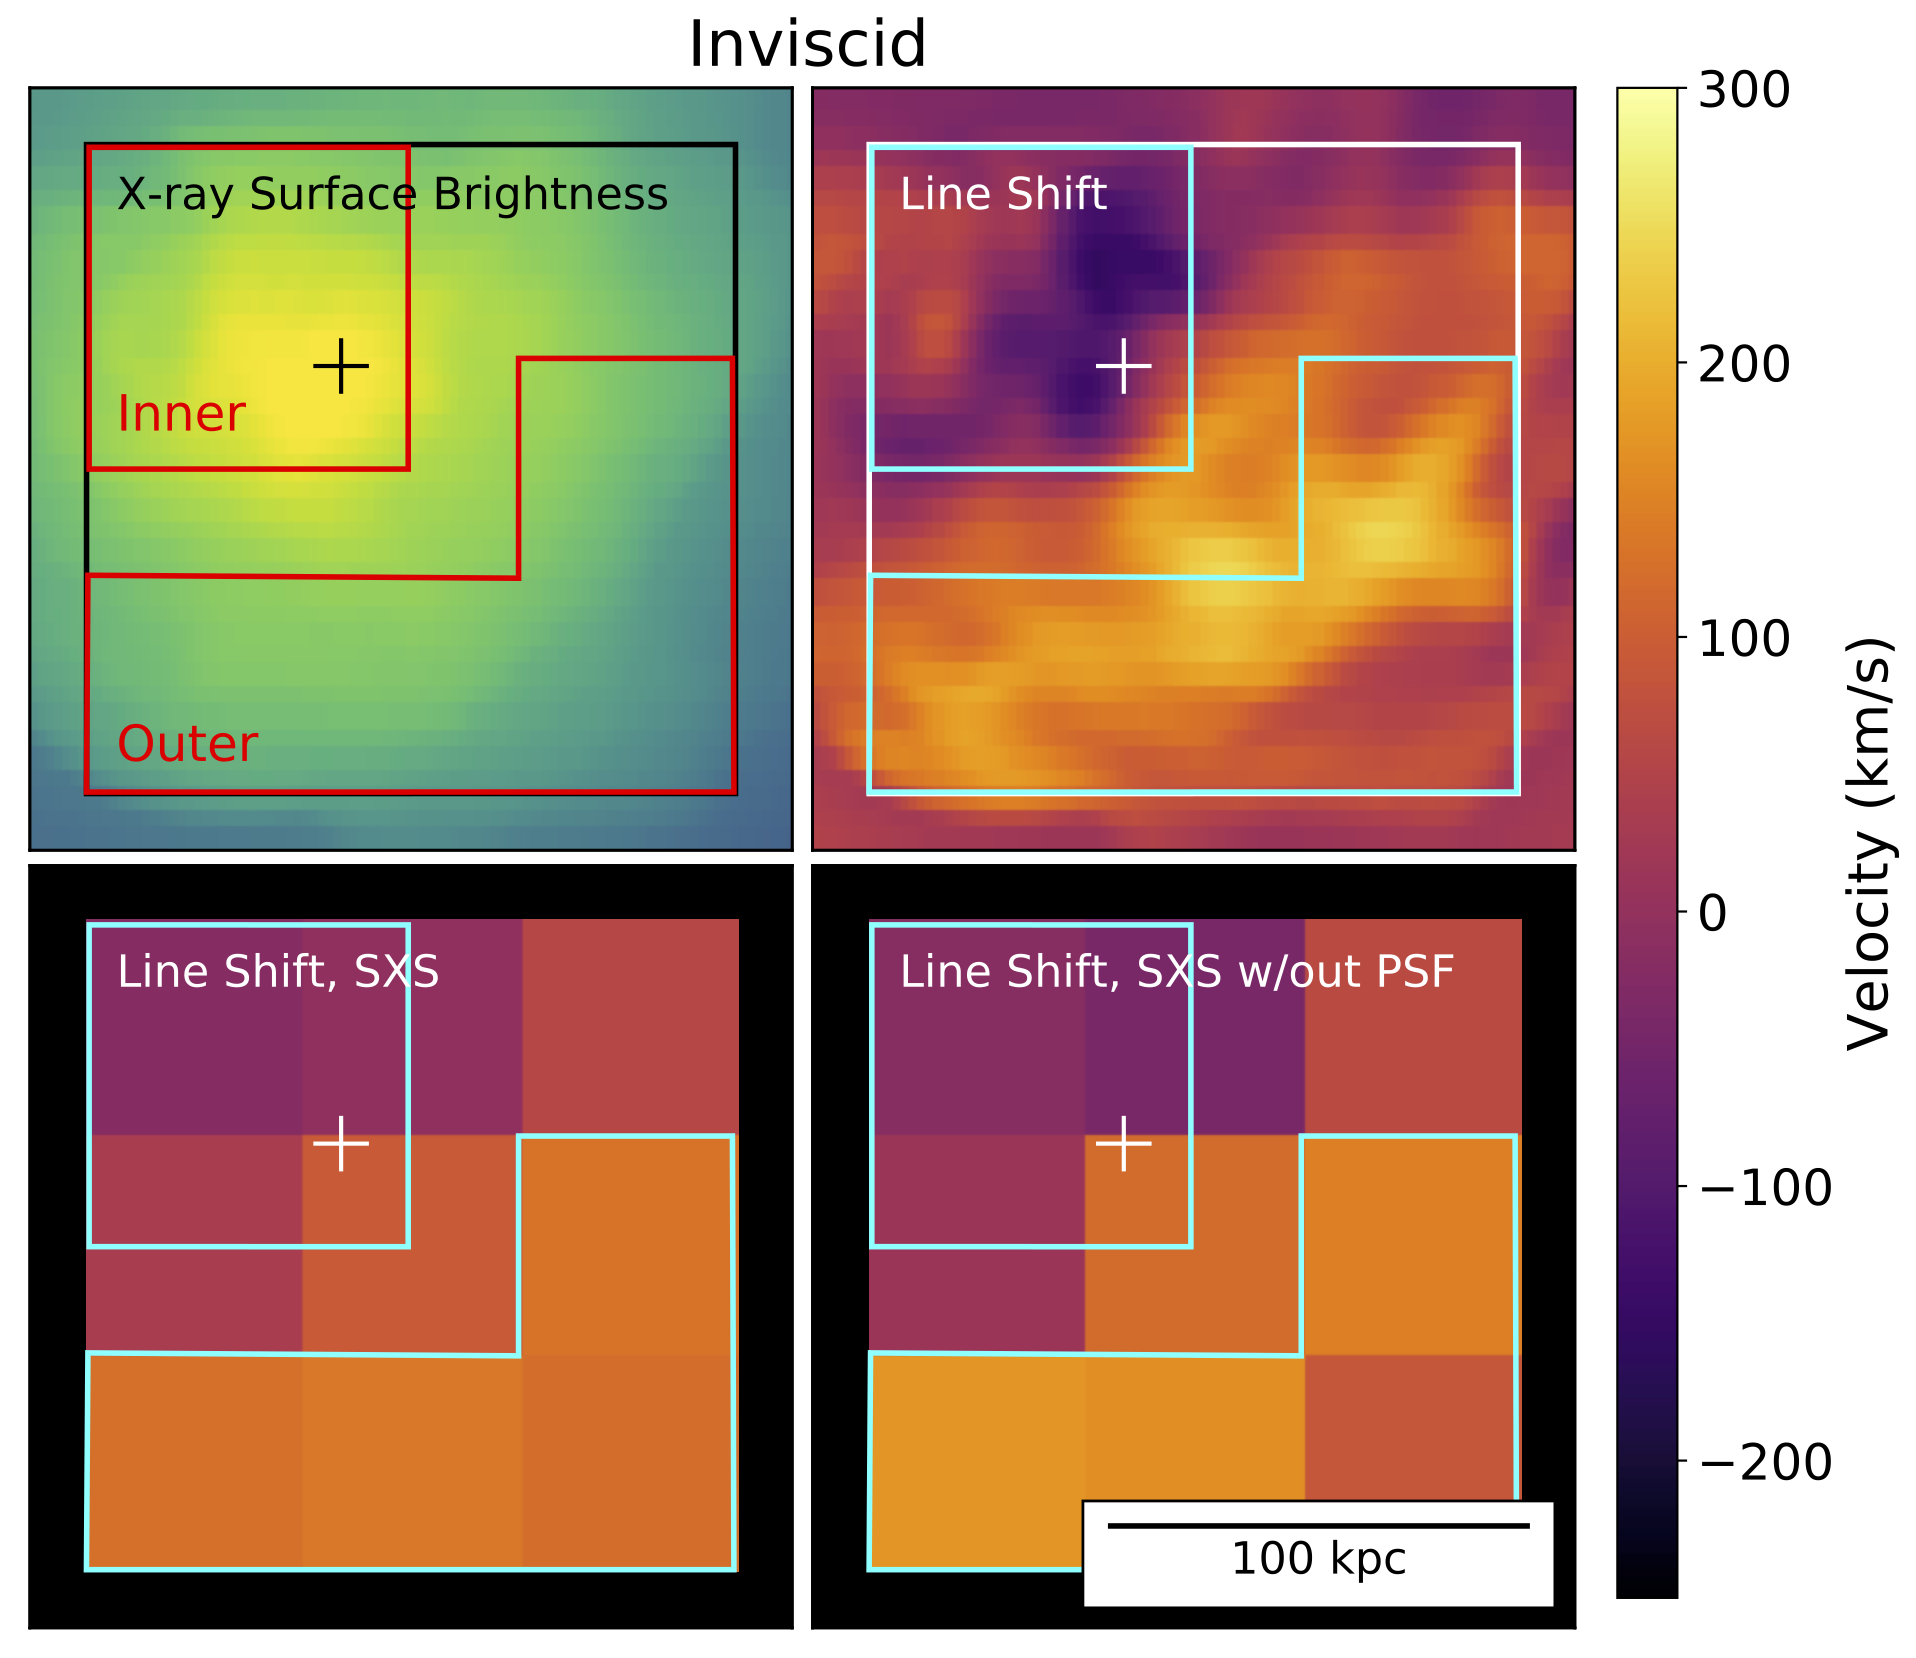
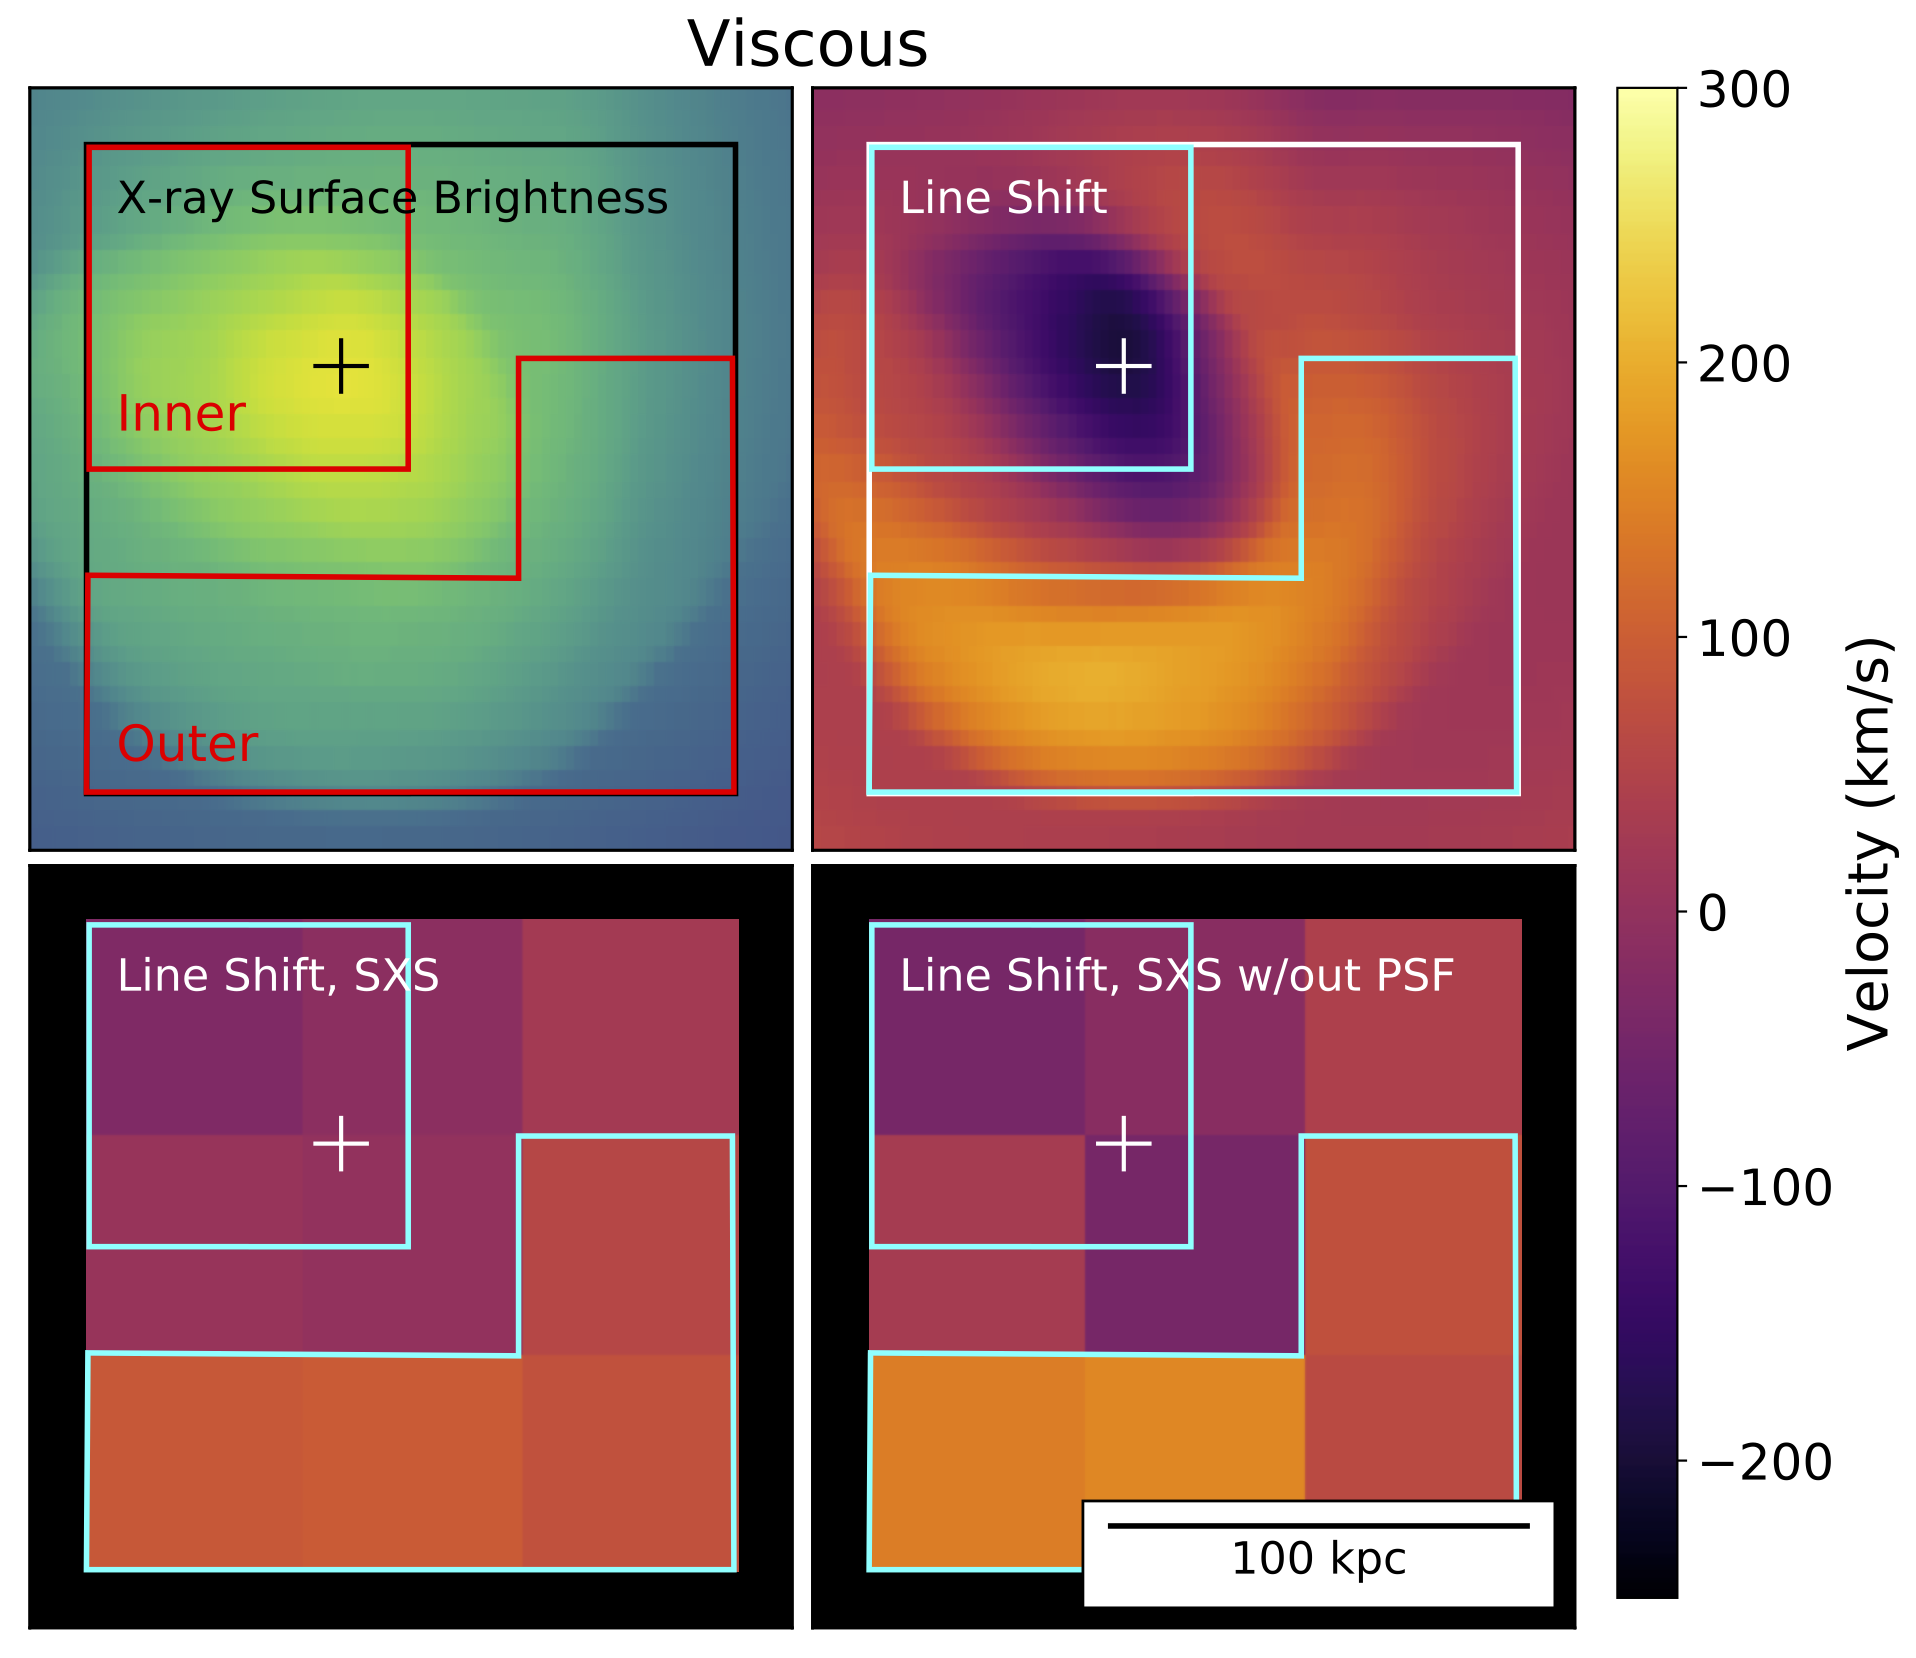
In (ZuHone et al., 2016) we made predictions for what Doppler shifting and broadening signatures such sloshing motions would make using mock Hitomi (then called Astro-H) observations of FLASH hydrodynamic simulations of core gas sloshing (notably without AGN feedback included). We explored two simulations, one inviscid, and another with Spitzer viscosity. The latter is unrealistic in the ICM due to the effect of magnetic fields making viscosity anisotropic, but serves as a useful extreme test for the effect of viscosity on line shapes due to velocities.
We found that in the case of sloshing, the line broadening is not changed significantly in the presence of such extreme viscosity (at least on the spatial scales at which Hitomi was able to observe given its ~1-arcminute PSF). This is because the origin of the majority of the line broadening is from the bulk sloshing motions themselves and not turbulent motions at smaller scales, which are more effectively damped by viscosity. A mission with higher angular resolution would be capable of measuring velocity differences across the cluster core and thereby constrain them on smaller scales to more effectively probe viscosity.
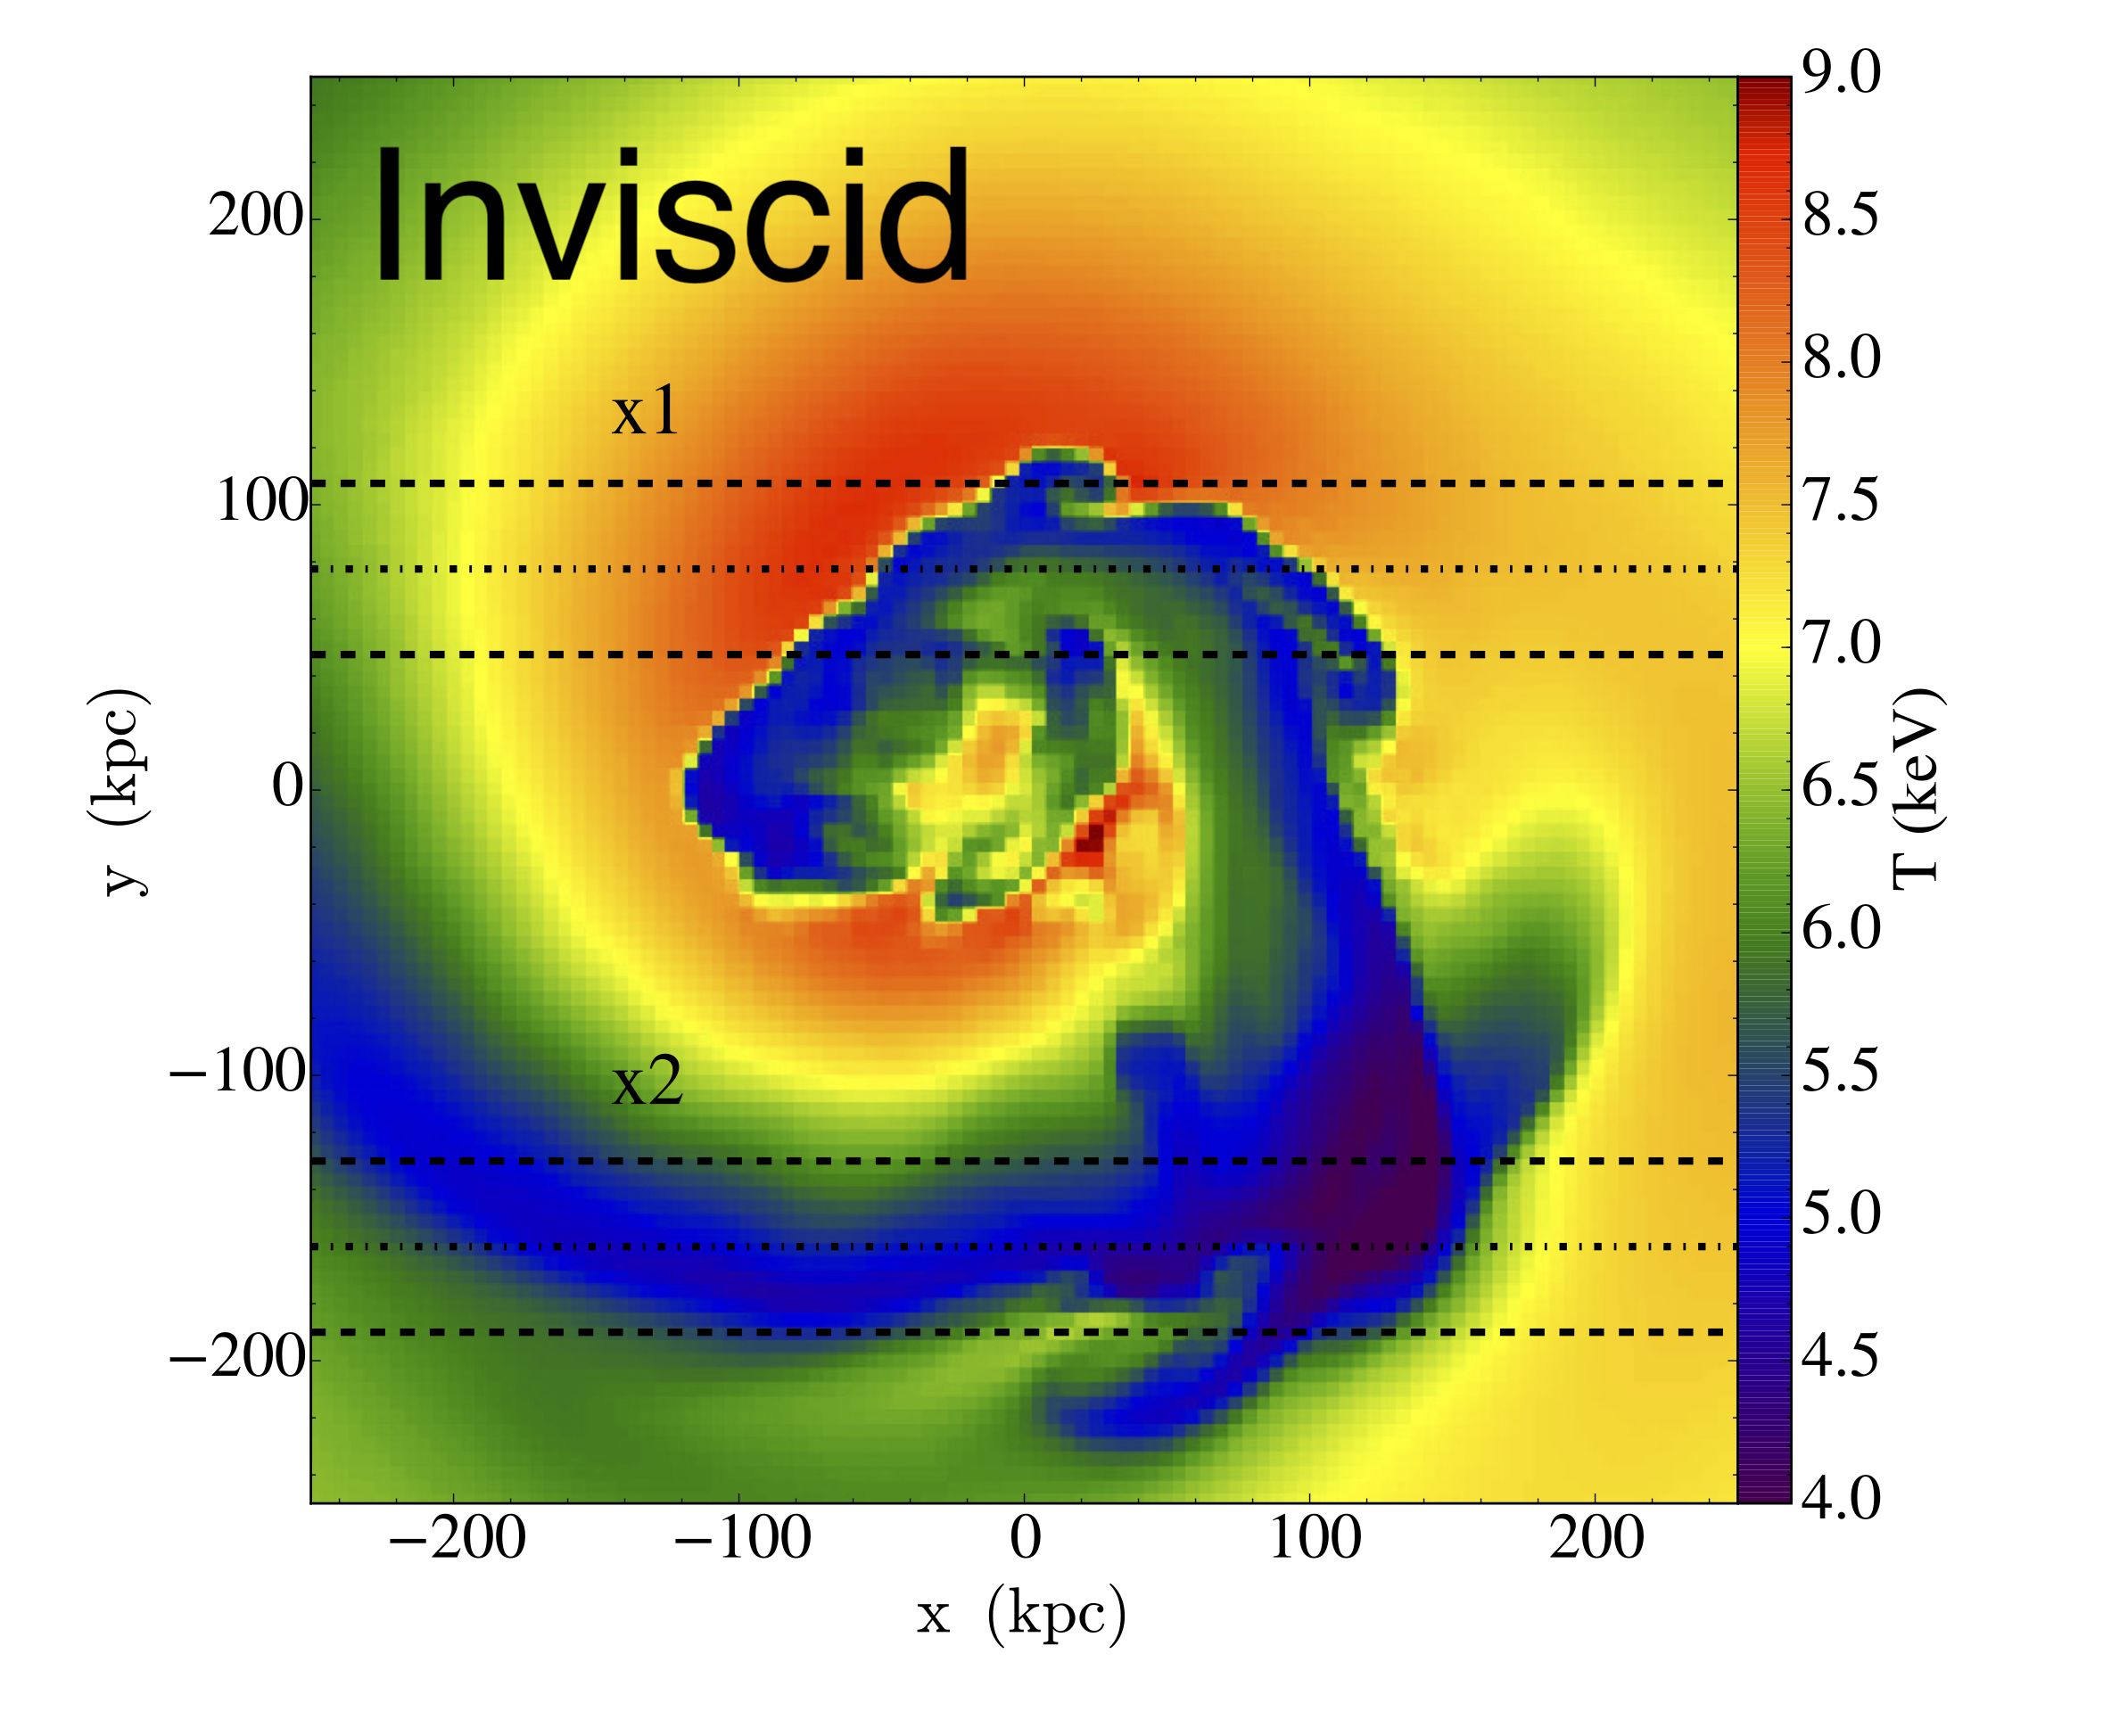
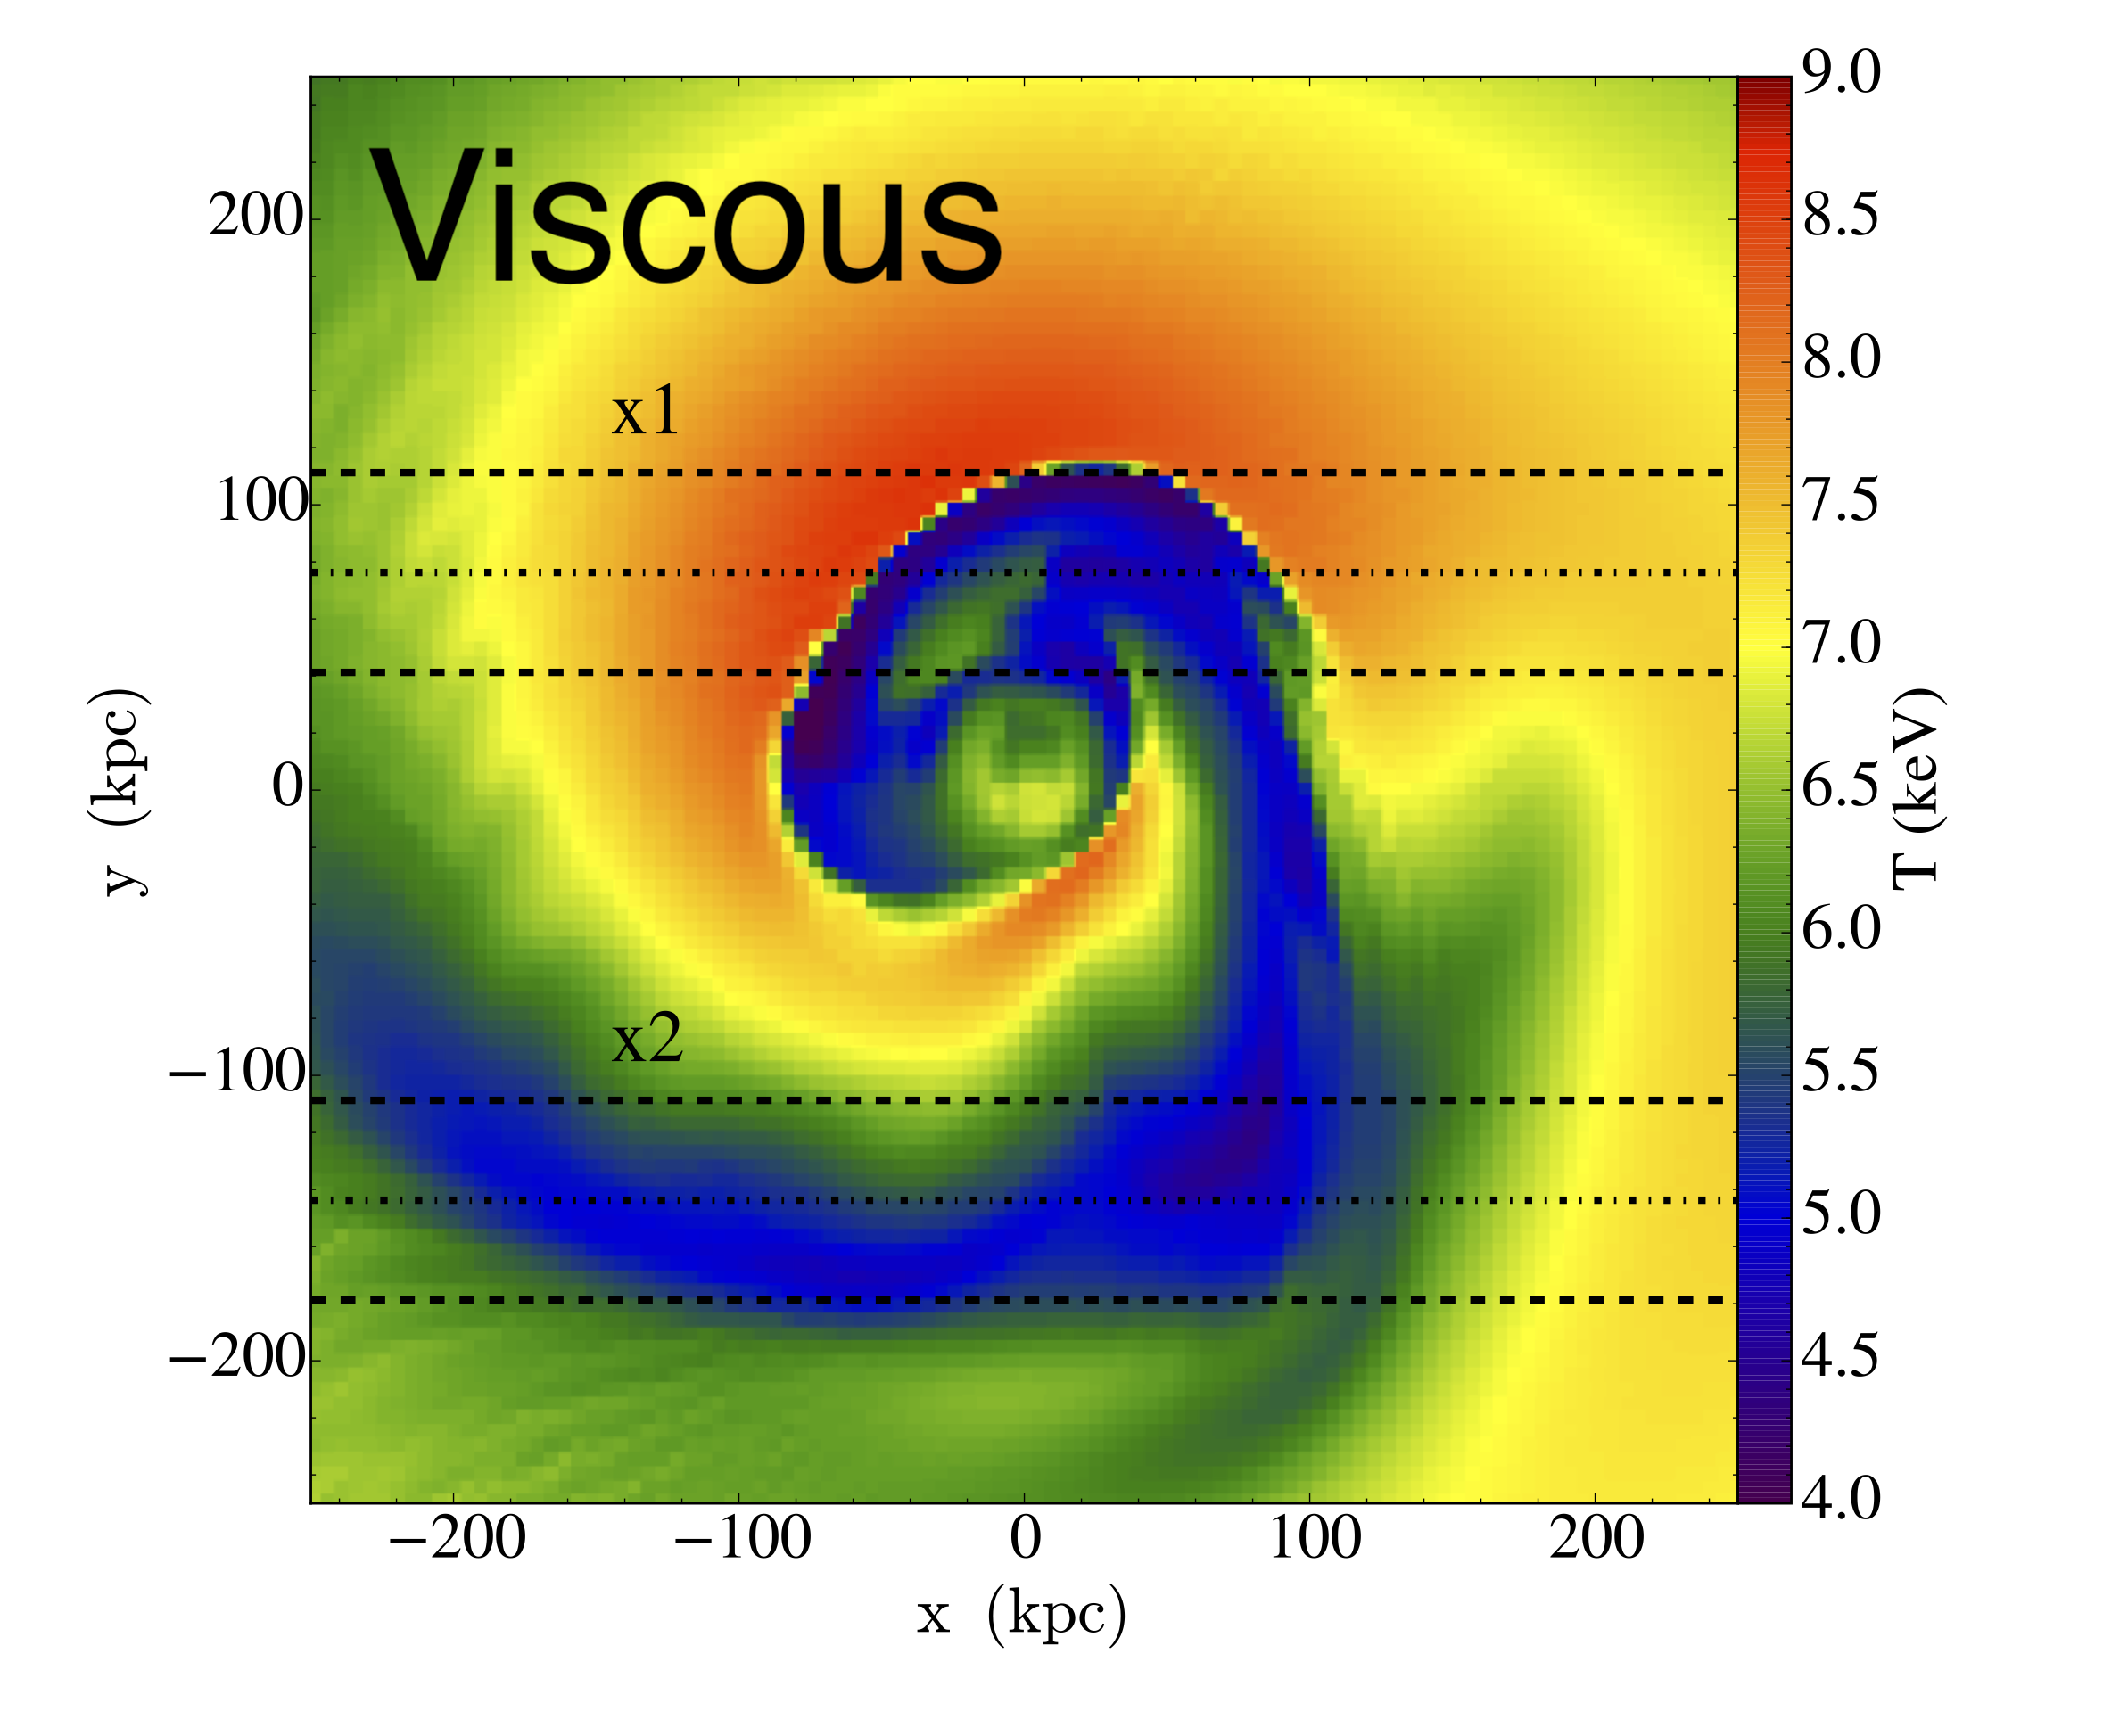
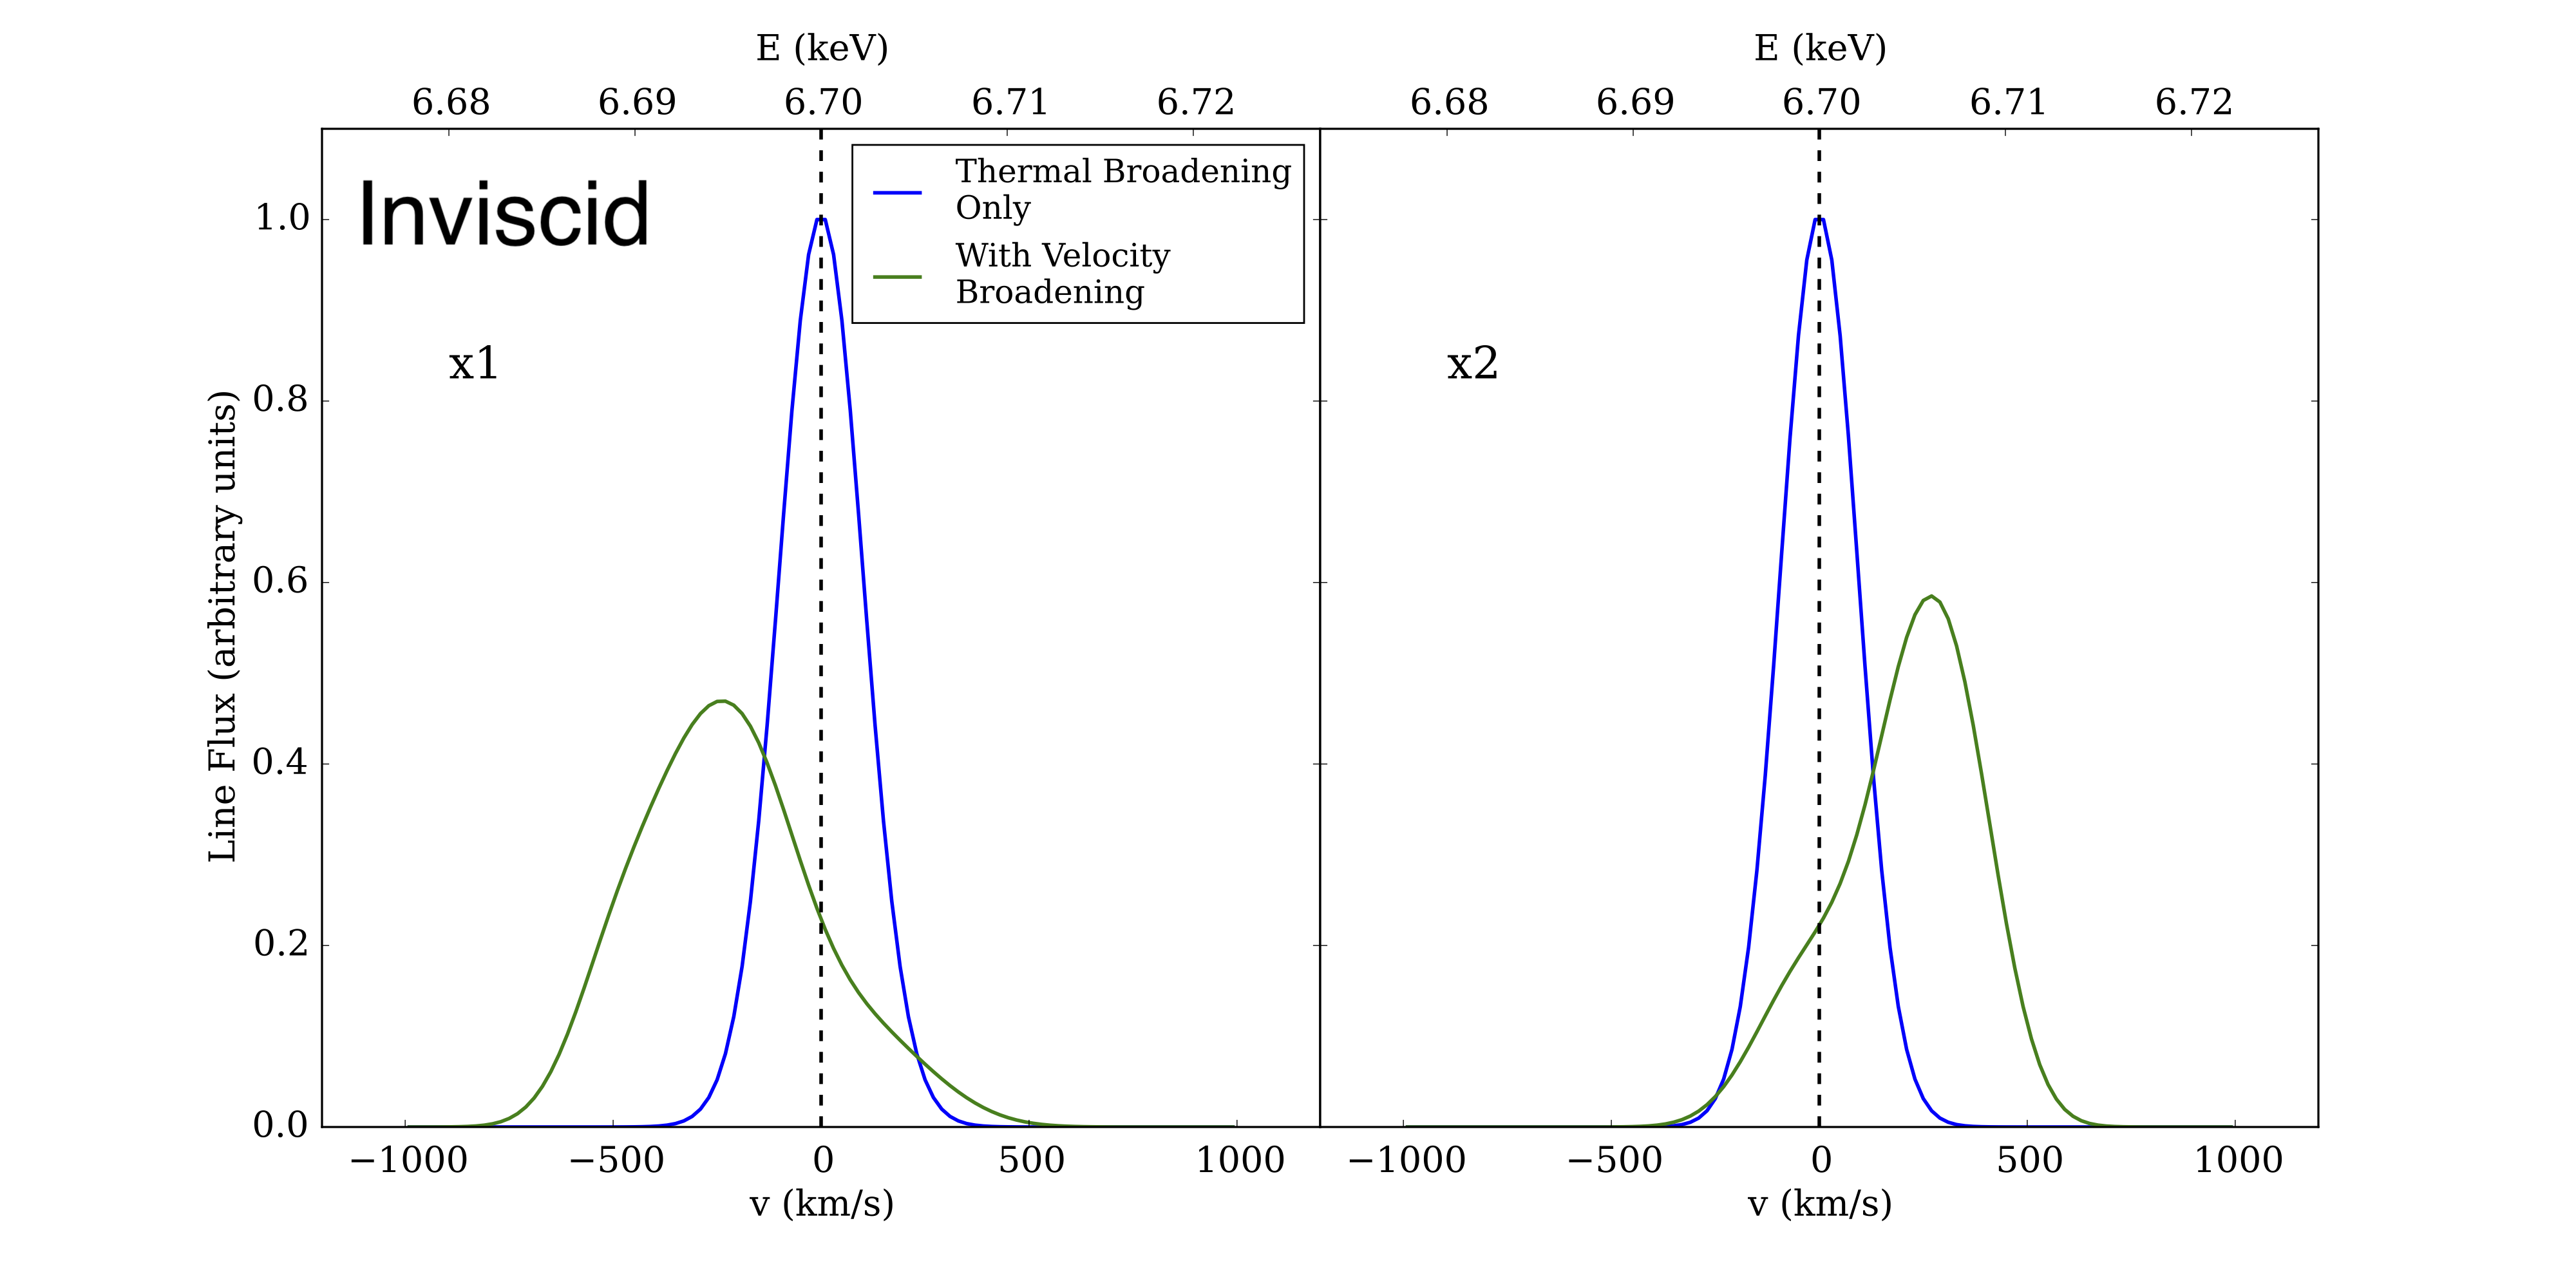
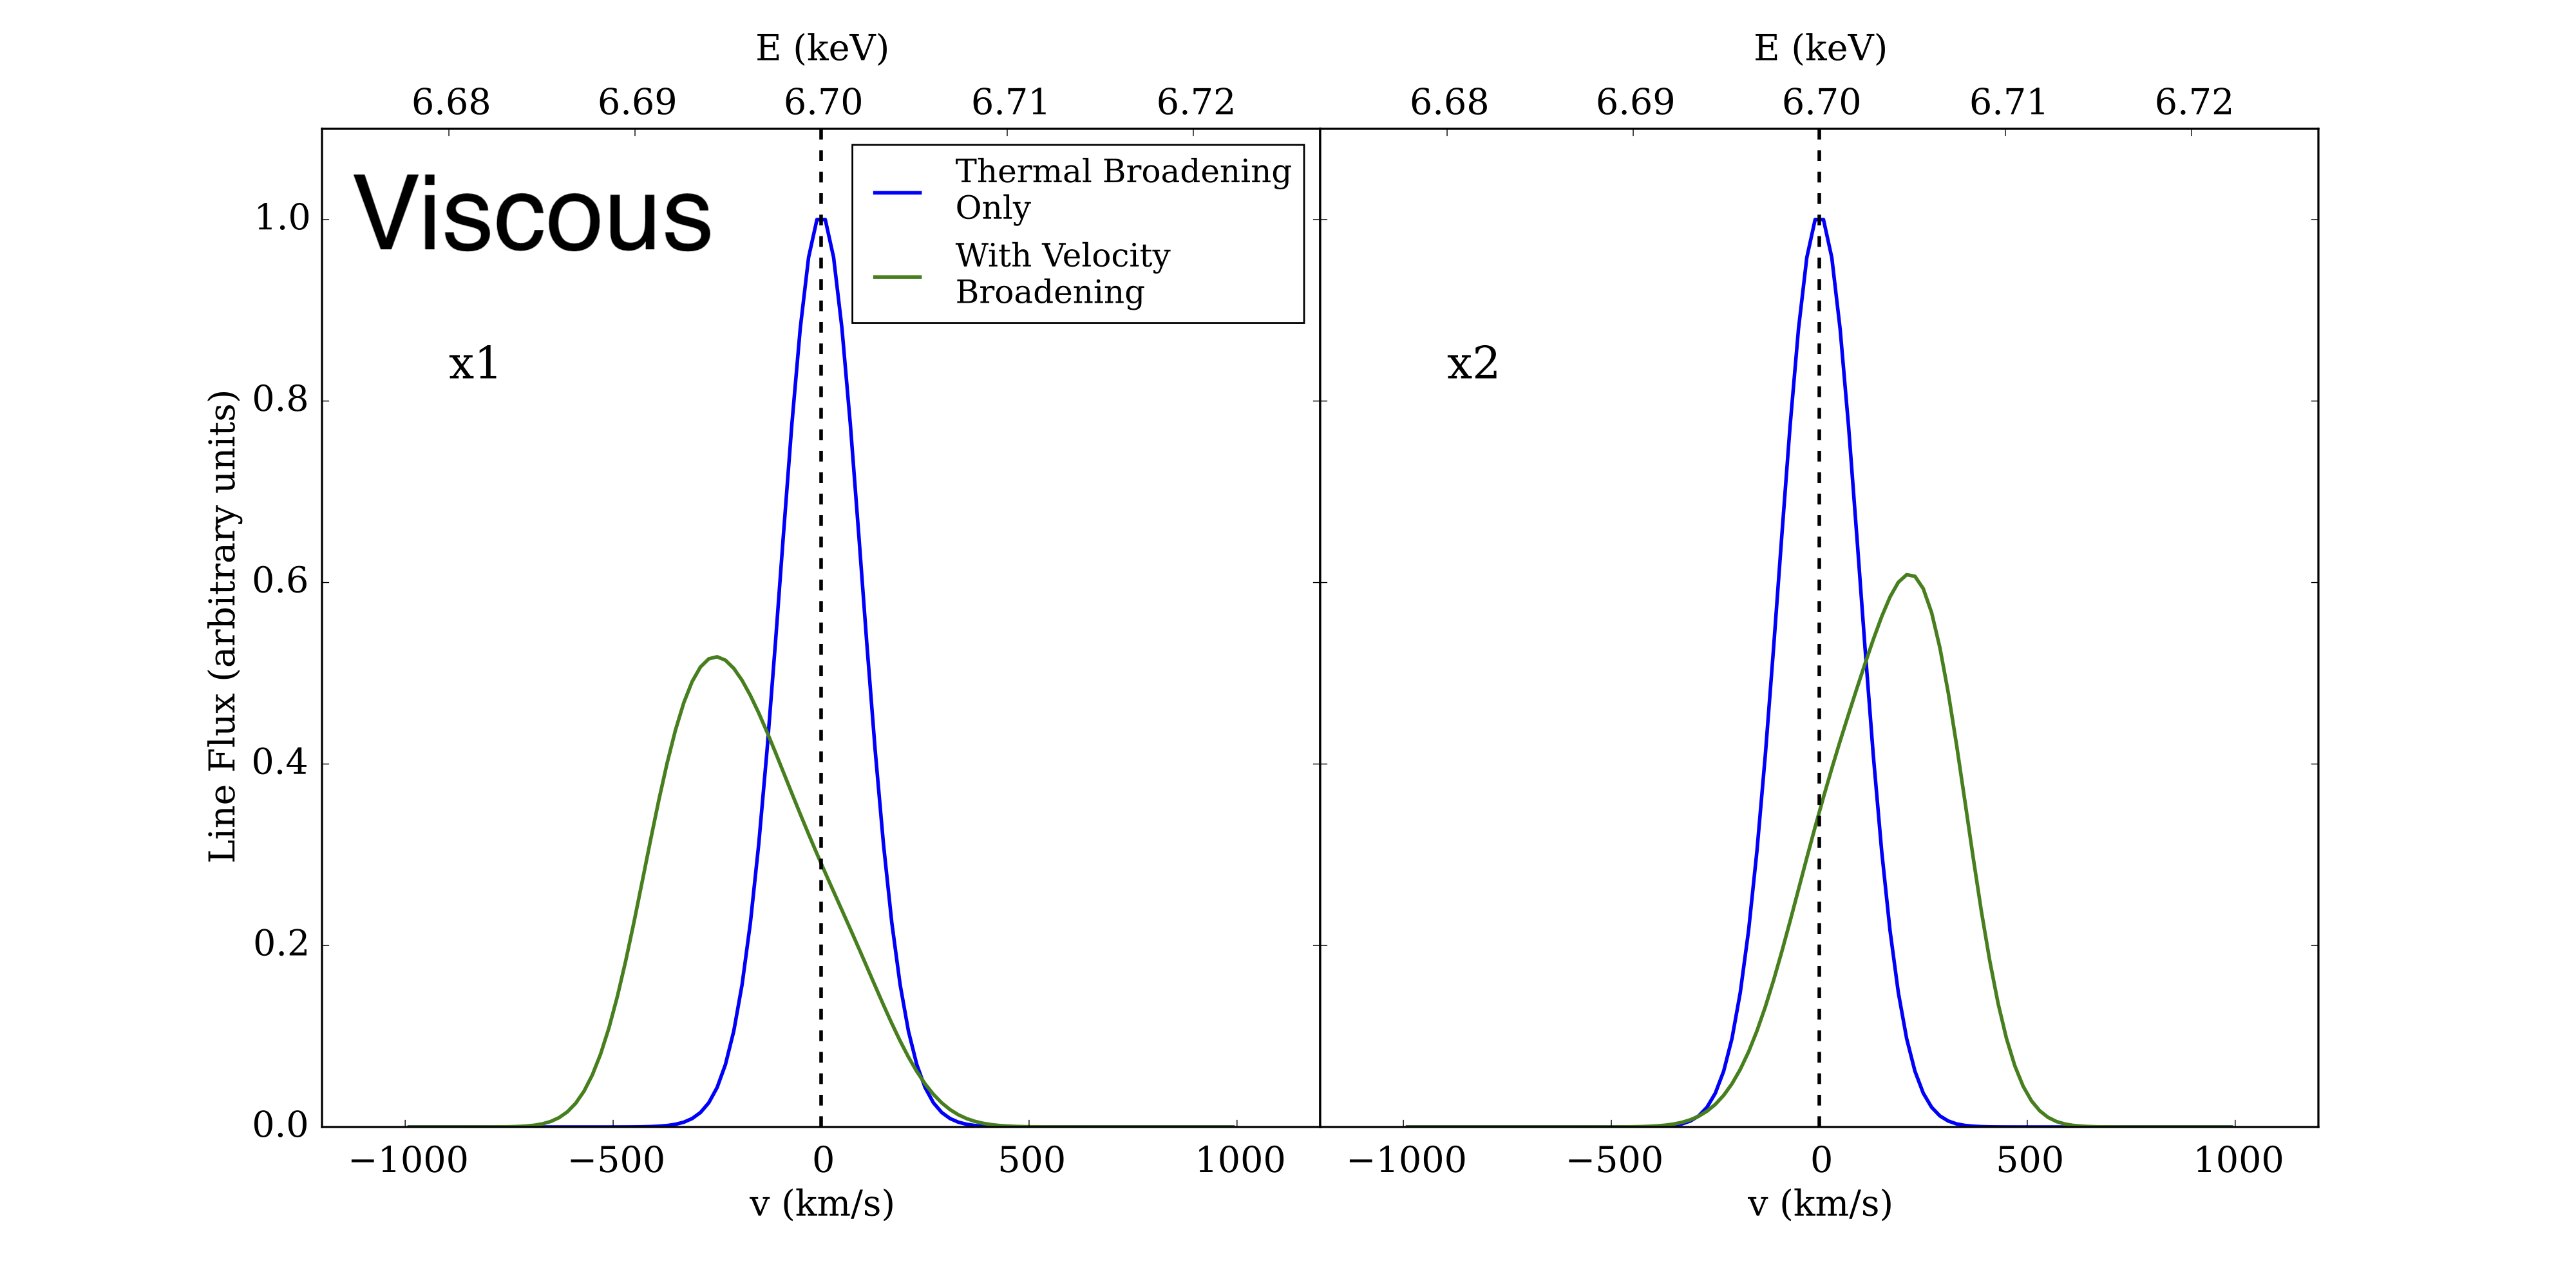
Thus, when Perseus was later observed by Hitomi (Hitomi Collaboration et al. (2016), Hitomi Collaboration et al. (2018)), and it was reported that the gas motions in the core were quiescent, this does not necessarily imply that viscosity is strong, as shown in (ZuHone et al., 2016), it simply means that the drivers of motions are not strong. It is also the case that for the stratified atmospheres of cool-core clusters, projection effects dictate that the length scales at which velocities are being measured strongly depend on the distance from the cluster core (see Zhuravleva et al. 2012), such that dispersions in the center must necessarily be measured to be smaller. We explored these effects in more detail after publication of the Hitomi measurements in (ZuHone et al., 2018), showing the effects of varying the line of sight with respect to the sloshing motions and the gradients of velocity across the cluster core that are produced in both inviscid and viscous cases (Figure 3).
